- Published on
Approximating 3d6 Using A Normal Distribution
- Authors
- Name
- David Gordon
3d6
The earliest editions of D&D had one generate their character's statistics by rolling three six sided dice and summing the results. Each summation would be applied to an attribute on the character sheet in the order in which they are presented. What is interesting about this particular mechanic is how closely the probability distribution of the summed results of a 3d6 roll resembles a normal distribution.
To see how closely 3d6 aligns with a normal distribution, we can generate every possible 3d6 result, compute the standard deviation and mean, and compare the frequency of these generated results to the output of the normal distribution function.
Generating Every Result:
def get_3d6():
    results = []

    def recurse(current_dice, results):
        if (len(current_dice) == 3):
            return sum(current_dice)

        for i in range(1, 7):
            temp = list(current_dice)
            temp.append(i)
            result = recurse(temp, results)
            if result:
                results.append(result)

    recurse([], results)
    return results
Calculating The Standard Deviation
- One of the summed results in our 3d6 summations.
- The mean of the summed results.
- The population, in this case , as we have total results.
- Our standard deviation.
def standard_deviation(results):
	n = len(results)
	mean = sum(results) / n
	standard_deviation = (sum((x-mean)**2 for x in results) / n) ** 0.5
	return standard_deviation
The Normal Distribution PDF
- The mean of the summed results.
- Our standard deviation.
def normal(x, deviation, mean):
    return (1 / (deviation * math.sqrt(2 * math.pi) )) * math.exp((-1/2) * ( ((x - mean) / deviation) ** 2 ))
Plot of Both Results 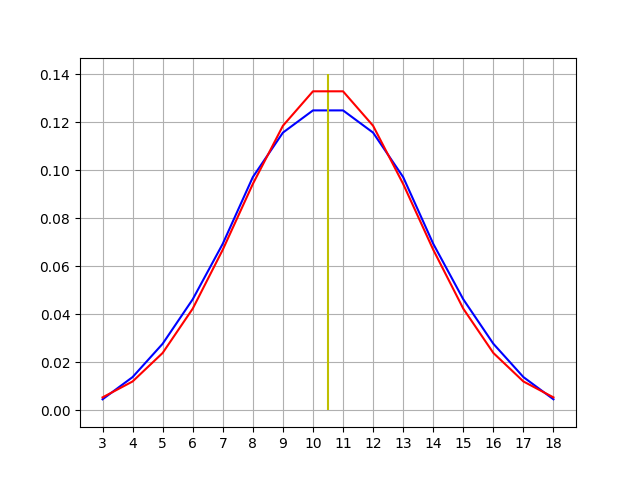
- Red: The plot of the normal distribution function.
- Blue: A frequency plot of the brute force generated results.
- Yellow: The mean of all possible 3d6 results (10.5).